相关概念
Prometheus 是一个开源的系统监控和报警工具包,最初由 SoundCloud 开发,现在是 Cloud Native Computing Foundation(CNCF)的一部分。Prometheus 以其强大的数据收集和查询能力、易于扩展和高可用性在行业内得到了广泛应用。以下是 Prometheus 的核心概念:
-
时间序列数据库:Prometheus 主要用于存储时间序列数据,即带有时间戳的指标数据。每个时间序列由一个指标名和一组标签(key-value 对)标识。
-
多维数据模型:Prometheus 的数据模型基于指标名称和标签,可以灵活地对监控数据进行分类和过滤,从而实现复杂的查询和分析。
-
PromQL:Prometheus 查询语言(PromQL)用于实时查询和分析存储在 Prometheus 中的数据。它支持丰富的运算符和函数,能够满足多种监控和报警需求。
Grafana 是一个开源的可视化和监控平台,广泛应用于数据分析、监控和报警。它支持多种数据源,提供丰富的可视化工具,使用户能够创建交互式的仪表盘。以下是 Grafana 的核心功能:
-
数据可视化:Grafana 提供了多种图表类型,包括折线图、柱状图、饼图、热图等,用户可以通过拖拽的方式轻松创建和自定义仪表盘。
-
支持多种数据源:Grafana 支持从多种数据源获取数据,包括 Prometheus、InfluxDB、Graphite、Elasticsearch、MySQL、PostgreSQL 等。它还支持云服务提供商的数据源,如 AWS CloudWatch 和 Google Cloud Monitoring。
-
灵活的查询和过滤:通过集成的数据源查询语言,Grafana 允许用户灵活地对数据进行过滤、聚合和转换。每种数据源都有专门的查询编辑器,帮助用户编写查询语句。
-
报警和通知:Grafana 提供强大的报警功能,允许用户基于查询结果设置报警规则。当条件满足时,可以通过邮件、Slack、PagerDuty 等多种渠道发送通知。
-
用户管理和权限控制:Grafana 提供详细的用户管理和权限控制功能,支持用户、团队和组织的管理。用户可以根据需要设置不同的访问权限,保护敏感数据。
安装部署
环境信息
这里主要是两个主机,一个作为 Prometheus 的服务端,另一个作为被监控主机:
| 主机IP | 角色 | 用途 |
|---|---|---|
| 192.168.0.203 | Prometheus Server | 运行 Prometheus 和 Grafana |
| 192.168.0.202 | node_exporter | 运行 node_exporter 主机采集程序 |
容器部署
这里直接使用容器运行 Prometheus 和 Grafana 就行,启动方式为 docker-compose 运行,服务配置文件 docker-compose.yml 内容如下:
version: '3.7'

services:
  grafana:
    image: grafana/grafana:latest
    container_name: grafana
    ports:
      - "3000:3000"
    environment:
      - GF_SECURITY_ADMIN_PASSWORD=admin
    volumes:
      - grafana-storage:/var/lib/grafana
    depends_on:
      - prometheus

  prometheus:
    image: prom/prometheus:latest
    container_name: prometheus
    ports:
      - "9090:9090"
    volumes:
      - prometheus-storage:/prometheus
      - ./prometheus:/etc/prometheus

volumes:
  grafana-storage:
    driver: local
  prometheus-storage:
    driver: local
执行启动:
docker-compose up -d
启动之后,访问 9090 端口为 Prometheus 服务管理页面,访问 3000 为 Grafana 管理平台,使用上面配置的 GF_SECURITY_ADMIN_PASSWORD 密码等于即可。
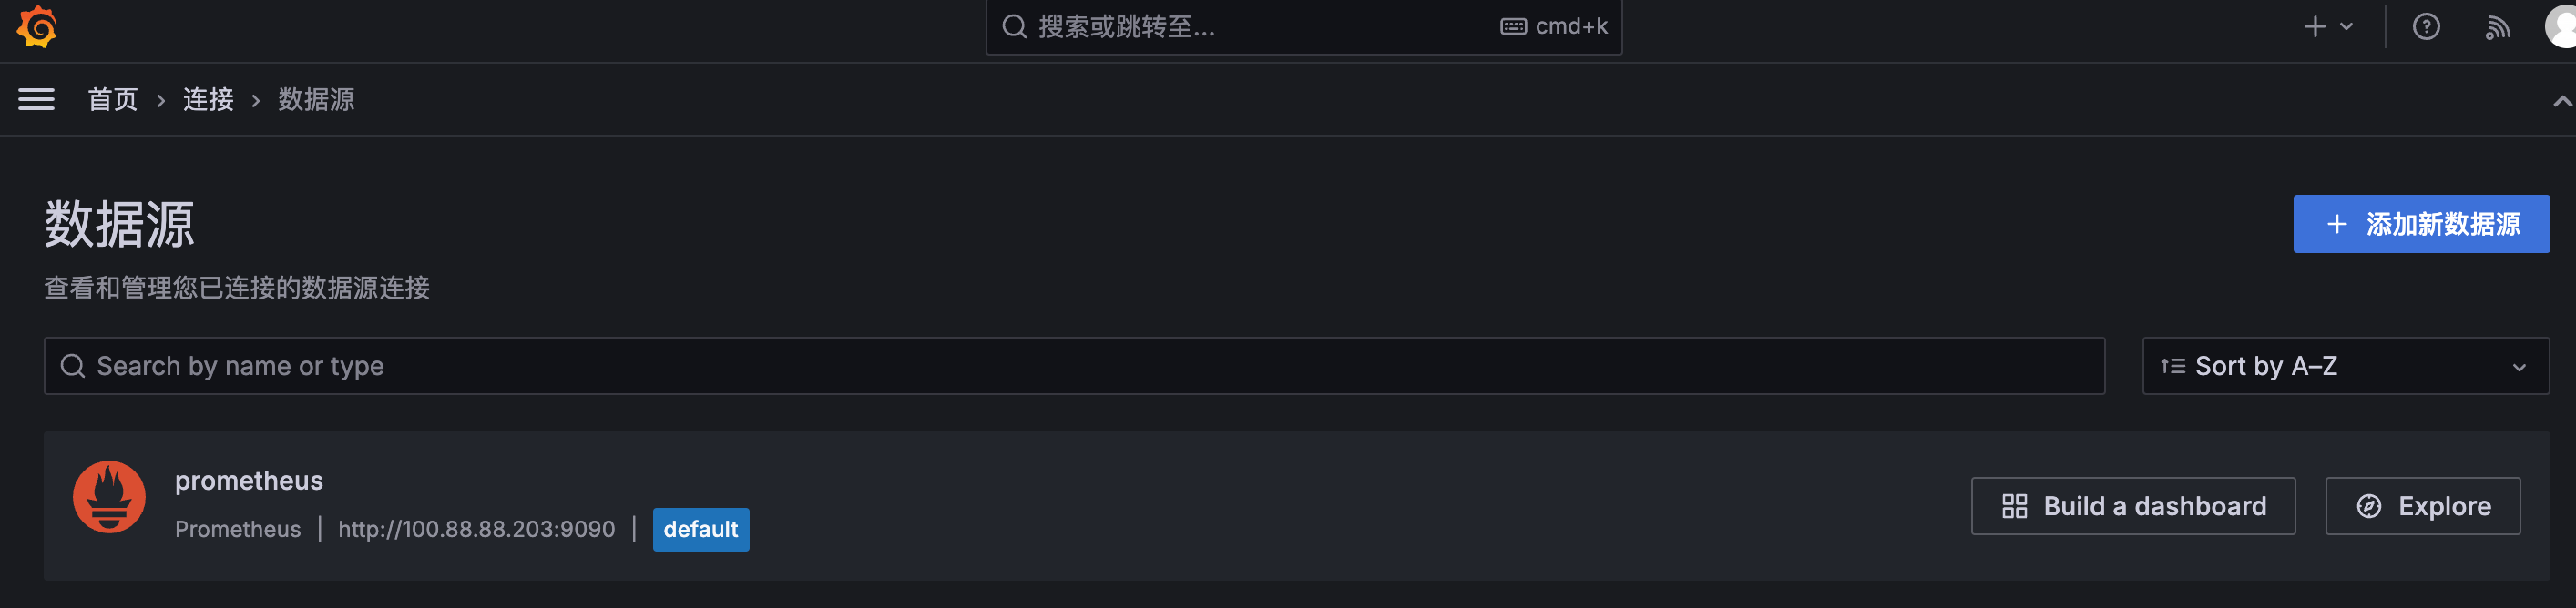
安装之后按理这里会有一个默认的数据源,指向的是本机 Prometheus 的地址,如果没有,或者 Prometheus 信息不对可以自行修改或者创建数据源。
配置主机监控
1. 客户端安装 node_exporter
node_exporter 是一个 Prometheus 官方出品的主机信息采集客户端,该程序会启动一个本地服务,暴露端口 9100,持续采集主机信息,其他服务可以通过 API 接口获取到主机信息。
官方也提供了安装步骤:https://prometheus.io/docs/guides/node-exporter/
直接去项目的 github 中下载对应的安装包,然后解压后执行即可:
cd /usr/local
# 下载安装包
wget https://github.com/prometheus/node_exporter/releases/download/v1.8.1/node_exporter-1.8.1.linux-amd64.tar.gz
# 解压包并重命名
tar -zxvf node_exporter-1.8.1.linux-amd64.tar.gz
mv node_exporter-1.8.1.linux-amd64 node_exporter
rm -f node_exporter-1.8.1.linux-amd64.tar.gz
# 启动服务
cd node_exporter
./node_exporter
也可以创建成服务来运行,创建一个启动服务文件:
vim /etc/systemd/system/node_exporter.service
内容如下:
[Unit]
Description = node_export
Documentation = https://github.com/prometheus/node_exporter
After = network.target syslog.target
Wants = network.target

[Service]
Type = simple
ExecStart = /usr/local/node_exporter/node_exporter

[Install]
WantedBy = multi-user.target
启动服务并设置成开机起启动:
# 重新加载配置
systemctl daemon-reload
systemctl start node_exporter
systemctl enable node_exporter
systemctl status node_exporter
此时访问主机的接口可以查看到采集的信息:http://192.168.0.202:9100/metrics
2. Prometheus 添加主机监控
修改 Prometheus 的配置文件 prometheus/prometheus.yml,追加主机信息,修改之后的内容应该是如下:
global:
  scrape_interval: 15s

scrape_configs:
  - job_name: 'prometheus'
    static_configs:
      - targets: ['localhost:9090']
  - job_name: 'node'
    static_configs:
      - targets: ['192.168.0.202:9100']
然后重启 Prometheus 容器:
docker-compose restart
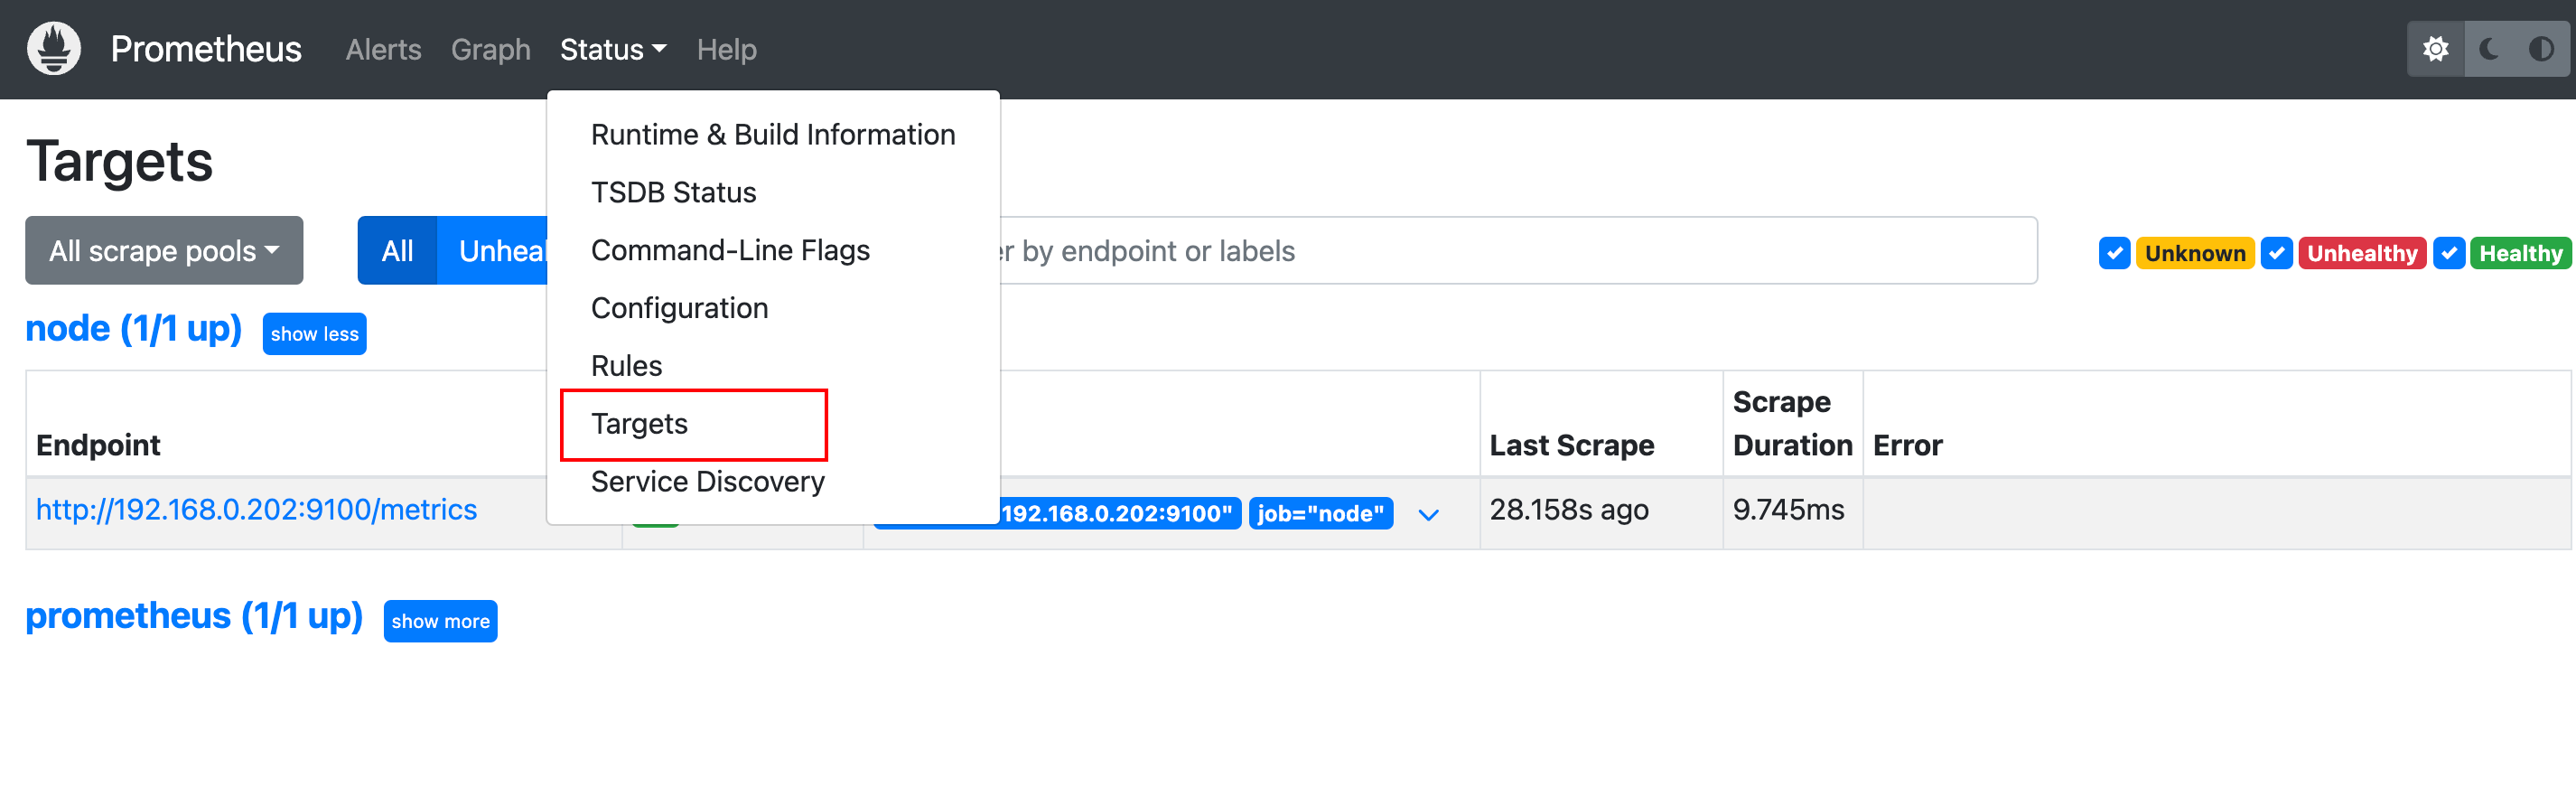
重启之后,就可以到 Prometheus 上看到新增的主机信息:
3. Grafana 安装主机监控面板
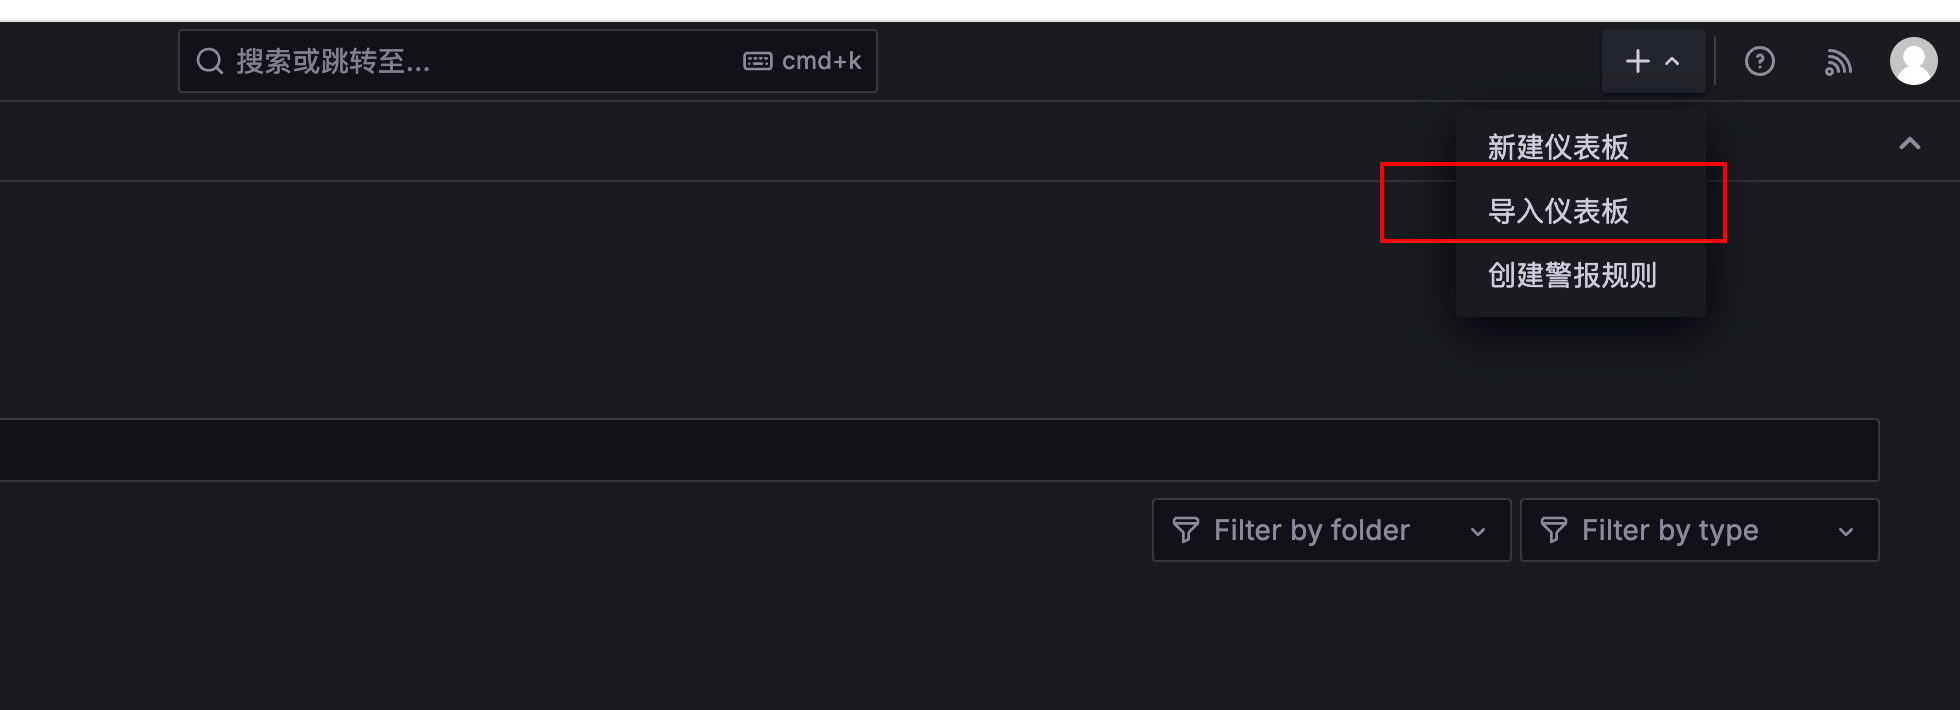
去官网下载一个监控 Dashboard 模板:https://grafana.com/grafana/dashboards/1860-node-exporter-full/
然后导入到 Grafana 中:
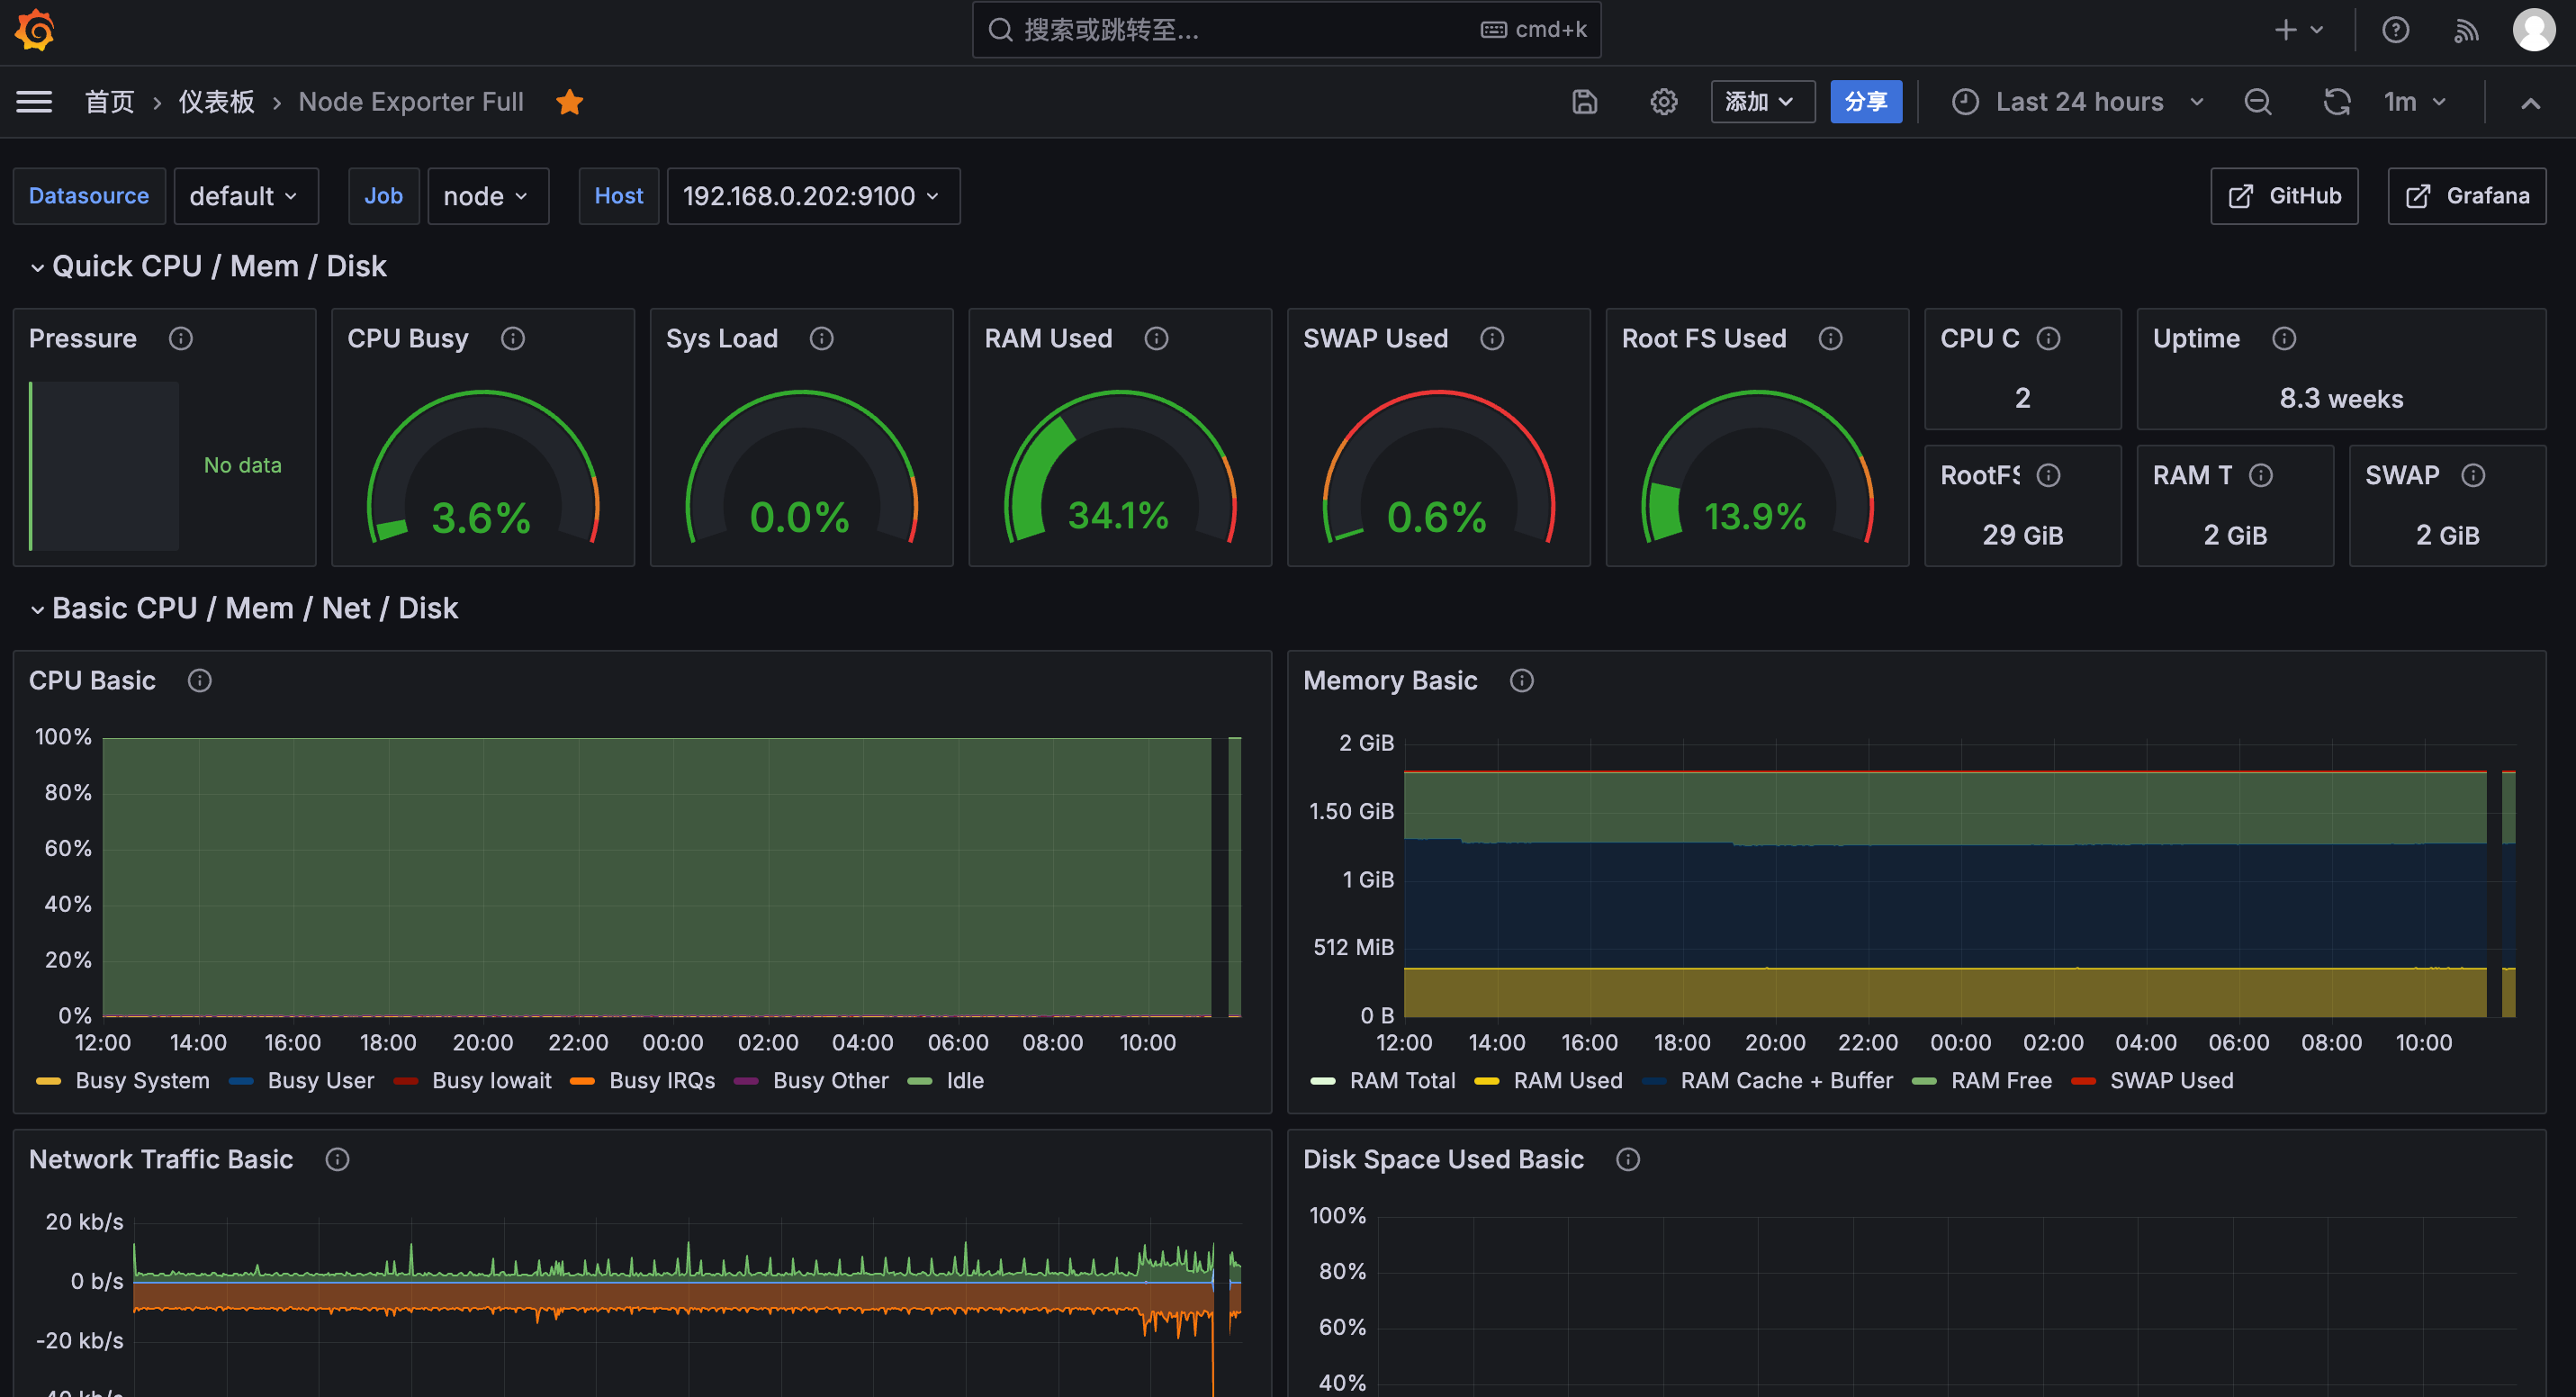
导入之后,在仪表盘就可以看到主机信息:
一键安装启动 node_exporter 脚本
#!/bin/bash

# 定义变量
VERSION="1.8.1"
INSTALL_DIR="/usr/local/node_exporter"
SERVICE_FILE="/etc/systemd/system/node_exporter.service"
LISTEN_PORT=9100

# 下载并解压 node_exporter
echo "Downloading node_exporter..."
curl -LO https://github.com/prometheus/node_exporter/releases/download/v$VERSION/node_exporter-$VERSION.linux-amd64.tar.gz

echo "Extracting node_exporter..."
tar -xzf node_exporter-$VERSION.linux-amd64.tar.gz

# 创建安装目录
echo "Creating install directory..."
sudo mkdir -p $INSTALL_DIR

# 移动文件到安装目录
echo "Moving files to install directory..."
sudo mv node_exporter-$VERSION.linux-amd64/node_exporter $INSTALL_DIR/

# 清理下载的文件
echo "Cleaning up..."
rm -rf node_exporter-$VERSION.linux-amd64*

# 创建 systemd 服务文件
echo "Creating systemd service file..."
sudo bash -c "cat > $SERVICE_FILE << 'EOF'
[Unit]
Description=Node Exporter
Wants=network-online.target
After=network-online.target

[Service]
ExecStart=$INSTALL_DIR/node_exporter --web.listen-address=:${LISTEN_PORT}

[Install]
WantedBy=default.target
EOF"

# 重新加载 systemd 服务
echo "Reloading systemd daemon..."
sudo systemctl daemon-reload

# 启动并启用 node_exporter 服务
echo "Starting node_exporter service..."
sudo systemctl start node_exporter
sudo systemctl enable node_exporter

# 重启服务,用于更新版本
echo "Restart service for update version."
sudo systemctl restart node_exporter
sudo systemctl status node_exporter

echo "Node Exporter installation and setup completed successfully."
版权声明:如无特殊说明,文章均为本站原创,转载请注明出处
本文链接:https://tendcode.com/subject/article/install-prometheus-and-grafana/
许可协议:署名-非商业性使用 4.0 国际许可协议
ye1088

1 楼 - 9月,2 周前
东西有用, 不过既然用docker 了, 不如直接推荐用docker里应用商店里直接安装会方便很多